Gazebo high resolution camera slow in ROS 2: image bandwidth
Short answer: An rgb8 image topic carries width x height x 3 x fps bytes (4512×4512 at 19 Hz = 1160 MB/s), and Gazebo renders a camera only once something subscribes.
What happened when it actually ran
In February 2025 someone asked on Robotics Stack Exchange why Gazebo crawls with a high-resolution camera. Their setup, on Gazebo Harmonic: one camera sensor at 4512×4512, format R8G8B8, update_rate 19. As soon as they subscribed to the image topic, with gz topic or through ros_gz_image, the real time factor (RTF) dropped from about 100% to about 20%. CPU and GPU were both below full load. When we checked on 2026-10-29 the question had 860 views and no answers (question via the Stack Exchange API). The same setup is also posted as a comment on gz-sensors issue #332.
Two things answer most of it:
- The data volume is easy to work out. An
rgb8image is width × height × 3 bytes. 4512×4512 is 61,074,432 bytes per frame, about 61 MB. At 19 Hz that’s about 1160 MB for every second of simulated time. - “As soon as I subscribed” changes more than the message traffic. In the Gazebo source, a camera with no subscriber doesn’t render at all. Subscribing turns on rendering, the GPU-to-CPU copy, serialization and publishing together. The before/after comparison is “camera off” against “camera fully on”, not “no messages” against “messages”.
To see how much the message path costs on its own, we left Gazebo out. A script published synthetic sensor_msgs/Image messages of the same sizes from one Python process and received them in another, on ROS 2 Jazzy in a container limited to 1 CPU and 1 GiB. It ran 5 times. In short:
- Every serialized message was exactly 52 bytes larger than width × height × 3, at every size.
- A reliable subscriber received 0.993–1.012 times the calculated MB/s from 640×480 up to 1920×1080 at 30 Hz, in all 5 runs.
- A best effort subscriber (the QoS that
ros2 topic bwandros2 topic hzuse) got as little as 0.624 times the calculated value at 1920×1080 in one run, while the publisher was holding 30 Hz. - At 3840×2160, and at the asker’s 4512×4512, the publisher itself couldn’t keep the target rate. A single
publish()call took longer than one frame period.
So the multiplication gives you the load the topic has to carry. Whether that much actually moves depends on QoS and frame size, and in Gazebo the rendering cost comes on top of it. The details follow.
Measured results
Environment: image ros:jazzy-ros-base pinned as ros@sha256:8eed0a4669bbf43ee331878a4c39bd8ebddea8e3312a58b4fae8edb14526b617, ROS distro jazzy, Python 3.12.3, rclpy 7.1.12-1noble.20260912.162354, RMW rmw_fastrtps_cpp (the default), network none, 1 CPU and 1 GiB of memory. No Gazebo, no image_transport, no numpy. The harness ran the same script (SHA-256 81199d6875385ae5d9a65c2d5286925034dcd18d63c16cf54944bf82bba30aab) 5 times. All 5 runs exited with code 0 and took 38.73–41.17 s each.
How it measures: the publisher is the main Python process. For each condition a fresh Python subscriber process subscribes with raw=True, the same way ros2 topic bw does, and records len() of each serialized message and its arrival time from time.monotonic(). It records for 2.5 s after the first message arrives. Received Hz = (n − 1) / (last arrival − first arrival). Received MB/s = bytes of all messages except the first, divided by the same span, with 1 MB = 106 bytes as in ros2 topic bw. The image buffer is built once per condition and reused, so the publish loop only updates the header stamp and calls publish(). If the publisher falls behind, it skips to the next period instead of catching up. The 4512×4512 conditions only ran at depth 1 because of the 1 GiB limit.
Message size and serialization time (no transport)
| Size (rgb8) | width × height × 3 | Serialized bytes | Overhead | Serialize time, median of 3, range over 5 runs |
|---|---|---|---|---|
| 640×480 | 921600 | 921652 | 52 | 1.439–1.532 ms |
| 1280×720 | 2764800 | 2764852 | 52 | 5.251–5.416 ms |
| 1920×1080 | 6220800 | 6220852 | 52 | 12.681–13.105 ms |
| 4512×4512 | 61074432 | 61074484 | 52 | 139.686–151.243 ms |
Prediction (plan.md, written before the runs): the serialized message would be “slightly” larger than width × height × 3. The plan gave no byte count. Measured: 52 bytes in every run, at every size, including the messages the subscribers received.
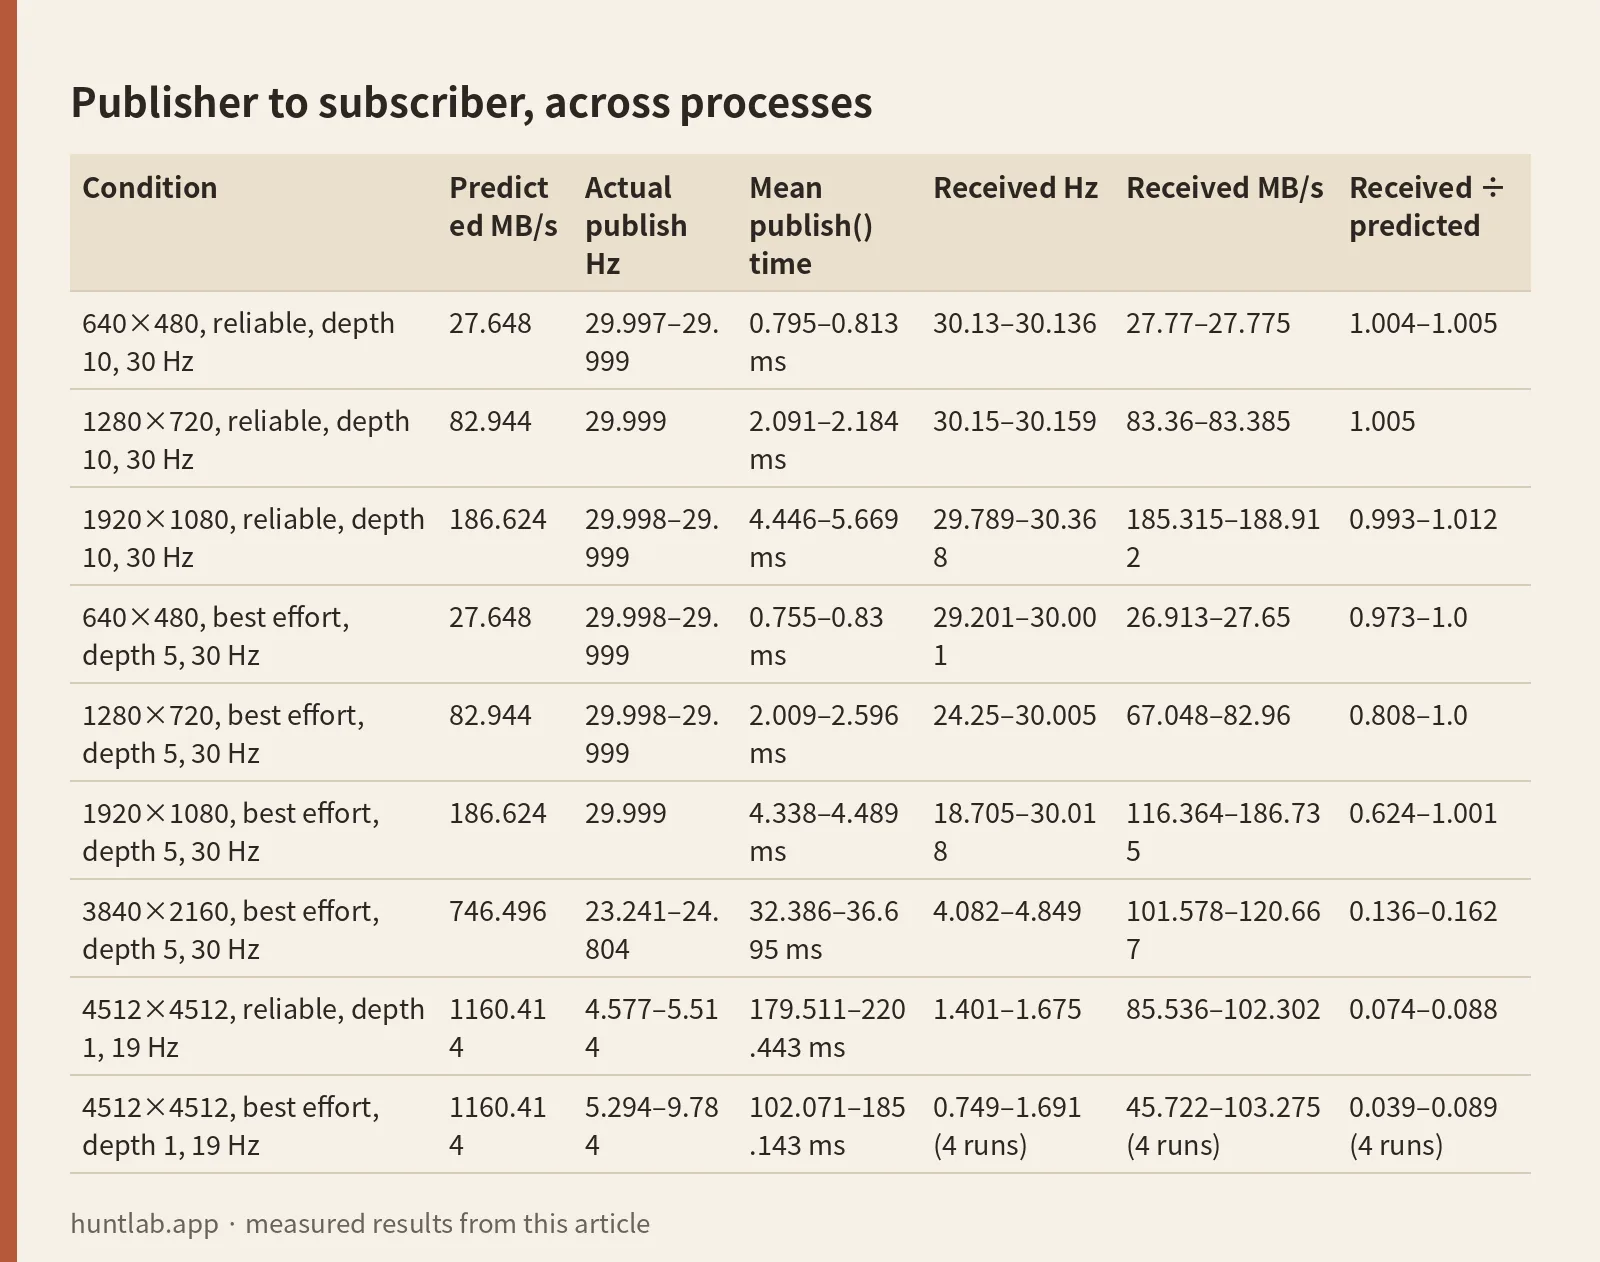
Publisher to subscriber, across processes
“Predicted MB/s” is the plan.md value at the target rate. All other columns are the minimum–maximum over the 5 runs.
| Condition | Predicted MB/s | Actual publish Hz | Mean publish() time |
Received Hz | Received MB/s | Received ÷ predicted |
|---|---|---|---|---|---|---|
| 640×480, reliable, depth 10, 30 Hz | 27.648 | 29.997–29.999 | 0.795–0.813 ms | 30.13–30.136 | 27.77–27.775 | 1.004–1.005 |
| 1280×720, reliable, depth 10, 30 Hz | 82.944 | 29.999 | 2.091–2.184 ms | 30.15–30.159 | 83.36–83.385 | 1.005 |
| 1920×1080, reliable, depth 10, 30 Hz | 186.624 | 29.998–29.999 | 4.446–5.669 ms | 29.789–30.368 | 185.315–188.912 | 0.993–1.012 |
| 640×480, best effort, depth 5, 30 Hz | 27.648 | 29.998–29.999 | 0.755–0.83 ms | 29.201–30.001 | 26.913–27.65 | 0.973–1.0 |
| 1280×720, best effort, depth 5, 30 Hz | 82.944 | 29.998–29.999 | 2.009–2.596 ms | 24.25–30.005 | 67.048–82.96 | 0.808–1.0 |
| 1920×1080, best effort, depth 5, 30 Hz | 186.624 | 29.999 | 4.338–4.489 ms | 18.705–30.018 | 116.364–186.735 | 0.624–1.001 |
| 3840×2160, best effort, depth 5, 30 Hz | 746.496 | 23.241–24.804 | 32.386–36.695 ms | 4.082–4.849 | 101.578–120.667 | 0.136–0.162 |
| 4512×4512, reliable, depth 1, 19 Hz | 1160.414 | 4.577–5.514 | 179.511–220.443 ms | 1.401–1.675 | 85.536–102.302 | 0.074–0.088 |
| 4512×4512, best effort, depth 1, 19 Hz | 1160.414 | 5.294–9.784 | 102.071–185.143 ms | 0.749–1.691 (4 runs) | 45.722–103.275 (4 runs) | 0.039–0.089 (4 runs) |
In run 3 the 4512×4512 best effort subscriber received no message at all, so there is no rate for that run. In the other 4 runs it received 3–4 messages in its window. A received rate slightly above 30 Hz comes from computing the rate over a short window from arrival gaps; the plan expected this.
Prediction for the breaking point: plan.md left “from which size does the subscriber stop getting the target rate” as an open question and made no prediction. The plan’s first draft only had the three smaller sizes; in trial runs they all arrived close to the target, so 3840×2160 and 4512×4512 were added.
Peak resident memory (VmHWM from /proc/self/status, whole process including rclpy and DDS): at 4512×4512 reliable depth 1, the publisher process peaked at 328.1–358.5 MB and the subscriber process at 307.7–308.4 MB. The depth × frame bound for that condition is 61.074 MB. At 1920×1080 best effort depth 5, the publisher peaked at 89.0–89.4 MB and the subscriber at 93.6–93.7 MB, against a bound of 31.104 MB.
Raw lines from run 2, exactly as printed: the 4512×4512 serialize-only line, then 1920×1080 best effort, 1920×1080 reliable and 4512×4512 reliable.
{"kind": "serialize", "width": 4512, "height": 4512, "frame_bytes": 61074432, "serialized_bytes": 61074484, "overhead_bytes": 52, "serialize_ms_median3": 151.243, "depth10_bound_MB": 610.744, "depth5_bound_MB": 305.372}
{"kind": "condition", "width": 1920, "height": 1080, "qos": "sensor_data", "reliability": "best_effort", "depth": 5, "target_hz": 30.0, "frame_bytes": 6220800, "predicted_MBps_at_target": 186.624, "depth_bound_MB": 31.104, "match_s": 0.151, "matched": true, "published": 105, "pub_hz": 29.999, "pub_call_ms_mean": 4.489, "pub_peak_rss_MB": 89.3, "pub_rss_reset": true, "sub_received": 39, "sub_window_s": 2.5, "sub_peak_rss_MB": 93.7, "sub_span_s": 2.0315, "sub_rx_hz": 18.705, "sub_rx_MBps": 116.364, "sub_msg_bytes_min": 6220852, "sub_msg_bytes_max": 6220852, "rx_over_predicted": 0.624, "rx_hz_over_pub_hz": 0.624, "overhead_bytes": 52}
{"kind": "condition", "width": 1920, "height": 1080, "qos": "default", "reliability": "reliable", "depth": 10, "target_hz": 30.0, "frame_bytes": 6220800, "predicted_MBps_at_target": 186.624, "depth_bound_MB": 62.208, "match_s": 0.151, "matched": true, "published": 105, "pub_hz": 29.999, "pub_call_ms_mean": 4.621, "pub_peak_rss_MB": 89.5, "pub_rss_reset": true, "sub_received": 77, "sub_window_s": 2.5, "sub_peak_rss_MB": 93.7, "sub_span_s": 2.5153, "sub_rx_hz": 30.215, "sub_rx_MBps": 187.962, "sub_msg_bytes_min": 6220852, "sub_msg_bytes_max": 6220852, "rx_over_predicted": 1.007, "rx_hz_over_pub_hz": 1.007, "overhead_bytes": 52}
{"kind": "condition", "width": 4512, "height": 4512, "qos": "reliable_depth1", "reliability": "reliable", "depth": 1, "target_hz": 19.0, "frame_bytes": 61074432, "predicted_MBps_at_target": 1160.414, "depth_bound_MB": 61.074, "match_s": 0.151, "matched": true, "published": 19, "pub_hz": 5.158, "pub_call_ms_mean": 193.814, "pub_peak_rss_MB": 328.2, "pub_rss_reset": true, "sub_received": 5, "sub_window_s": 2.5, "sub_peak_rss_MB": 307.9, "sub_span_s": 2.525, "sub_rx_hz": 1.584, "sub_rx_MBps": 96.752, "sub_msg_bytes_min": 61074484, "sub_msg_bytes_max": 61074484, "rx_over_predicted": 0.083, "rx_hz_over_pub_hz": 0.307, "overhead_bytes": 52}
What the numbers say, and what they don’t
This section is interpretation, not measurement.
The formula holds when nothing is dropped. With a reliable subscriber, width × height × 3 × fps matched what actually arrived to within 1.2% up to 1920×1080 at 30 Hz. If your measured bandwidth on a topic of that size is far below the formula, look at the subscriber or the clock first (see ros2 topic bw below), not at the formula.
Best effort drops without telling you. In run 2, the publisher sent 105 frames at 29.999 Hz and the best effort subscriber received 39 of them at 18.705 Hz. The plan expected these sizes to arrive close to the calculated rate. Reliable did; best effort didn’t in some runs. The test didn’t isolate why. It fits the definition of best effort (a sample the reader didn’t pick up in time is not resent) on a single CPU shared by the publisher, the subscriber and the DDS threads, but that is a reading of the result, not a measured cause.
At large frames the publisher becomes the bottleneck. At 30 Hz one period is about 33.3 ms. At 3840×2160 the mean publish() call took 32.386–36.695 ms, about a full period, and the publisher managed only 23.241–24.804 Hz. At 19 Hz one period is about 52.6 ms. Every 4512×4512 run spent 102.071 ms or more per publish() call, about twice that period or more. Serializing one 4512×4512 frame alone took about 140–151 ms with no transport. In this environment, Python can’t push 61 MB frames at 19 Hz even before any rendering happens.
Don’t generalize the breaking point. This was Python on one CPU core. ros_gz_bridge is C++, and the asker had an RTX 3070 machine. The test doesn’t show that “4512×4512 at 19 Hz is impossible over ROS 2”. It shows that once a frame is tens of MB, you have to check separately whether serializing and publishing fit inside one frame period at all.
Memory isn’t depth × frame size. The 4512×4512 processes peaked at several times one frame. VmHWM covers the whole process, and the test didn’t break down where copies were made. The depth bound tells you how many samples a queue may hold, not what the process will use.
Reproduce it
The script, the plan and the raw output of all 5 runs are in the reproduction code. Pinned files: experiment.py, plan.md and results.json. With Docker you can run it in the same image from an empty directory. You don’t need ROS installed.
mkdir gz-camera-bw && cd gz-camera-bw
curl -fsSLO https://raw.githubusercontent.com/sungpyo9053/blog/88bd7f67dfbcaa15d1c2bd61e64919cfa6e59bd1/experiments/gazebo-high-resolution-camera-image-topic-bandwidth-qos-depth/experiment.py
docker run --rm --network none --cpus 1 --memory 1g -v "$PWD":/work
  ros@sha256:8eed0a4669bbf43ee331878a4c39bd8ebddea8e3312a58b4fae8edb14526b617
  bash -c "source /opt/ros/jazzy/setup.bash && python3 /work/experiment.py"
It prints one JSON line per step and ends with a line containing "kind": "done". Expect about 40 s. To test your own camera, change RESOLUTIONS and CONDITIONS at the top of the script. Large sizes need small depths if you keep the 1 GiB limit. On a faster CPU the large-frame numbers will be different.
Bytes per frame and per second
sensor_msgs/Image is an uncompressed image. step is the length of one row in bytes, and data is step × rows bytes (Image.msg). For a Gazebo camera, 3 bytes per pixel isn’t an assumption:
- The SDF image
formatdefaults toR8G8B8(camera.sdf). - gz-sensors publishes that as
RGB_INT8(CameraSensor.cc). - ros_gz_bridge turns
RGB_INT8intorgb8withstep = width × 3(sensor_msgs.cpp L134–L137, L167–L169).
So:
bytes per frame  = width × height × bytes_per_pixel     (rgb8: 3, mono8: 1, rgba8: 4)
bytes per second = bytes per frame × update_rate
MB/s = bytes per second / 1,000,000| Camera (rgb8) | Bytes per frame | Rate | MB/s |
|---|---|---|---|
| 640×480 | 921,600 | 30 Hz | 27.648 |
| 1280×720 | 2,764,800 | 30 Hz | 82.944 |
| 1920×1080 | 6,220,800 | 30 Hz | 186.624 |
| 3840×2160 | 24,883,200 | 30 Hz | 746.496 |
| 4512×4512 | 61,074,432 | 19 Hz | 1160.414 |
A few things that trip people up:
- The rate is
update_rate, in simulated time. If you leave it out, the default is 0, which means “generate on every cycle” (sensor.sdf). Check your SDF before you plug a number into the formula. - MB is not Mb, and MB is not MiB. 1920×1080 rgb8 at 30 Hz is 186.624 MB/s, which is about 1493 Mb/s on a network link and about 178 MiB/s.
ros2 topic bwuses 1 MB = 1,000,000 bytes. - Halving both sides gives exactly a quarter. 2256×2256 at 19 Hz is about 290.1 MB/s instead of 1160.4. Going from 1920×1080 to 640×480 cuts the data 6.75 times, but it also changes the aspect ratio from 16:9 to 4:3, so you’re no longer looking at the same field of view.
QoS depth caps the queue, not the rate
The ROS 2 docs define keep last as “only store up to N samples, configurable via the queue depth option”. The default profile is keep last 10, reliable (About Quality of Service Settings, Jazzy). The sensor data profile is best effort with depth 5 (rmw qos_profiles.h). The ros_gz_bridge README shows queue sizes of 10 when no QoS is given (README L310–L316).
Multiply the depth by the frame size and you get the most image data one history can hold by definition:
- 1920×1080 rgb8: depth 10 → 62.208 MB, depth 5 → 31.104 MB, depth 1 → about 6.2 MB.
- 4512×4512 rgb8: depth 10 → 610.744 MB, depth 5 → 305.372 MB, depth 1 → 61.074 MB.
The publisher and the subscriber each have their own history, and the middleware has buffers of its own, so this isn’t a memory forecast. Depth also doesn’t change how often Gazebo renders or how often the bridge publishes. Lowering it limits how many stale frames can pile up and how much memory a queue may hold. There’s no reason to expect it to bring the RTF back.
Why subscribing is the moment Gazebo slows down
In gz-sensors 8, CameraSensor::Update returns before rendering when the image publisher has no connections, no image event is connected and saving is off. Only when something is connected does it call Render() and copy the image from GPU to CPU (CameraSensor.cc L485–L497). The gz-sim 8 Sensors system does the same at its level. It skips rendering sensors without connections when working out the next update (Sensors.cc L1283–L1286), and it temporarily disables them in the render loop (L476–L486).
Then, when there is a render update, PostUpdate waits for the previous render job to finish before it hands over the next one (L1005–L1018). Our reading of the source is that this wait is how slow rendering ends up slowing the simulation. A Gazebo maintainer said much the same in #332 back in 2023: cameras don’t update without subscribers, all server-side rendering sensors update on one render thread, and GPU-to-CPU readback, serialization and publishing can contend there. That was said for Gazebo Garden. The current Harmonic-series source behaves the same, but later performance work may have changed the numbers.
One more consequence, inferred from source and not run here: ros_gz_bridge starts its Gazebo-side subscription right away unless lazy is true, and lazy defaults to false (bridge_handle.cpp L53–L83). A non-lazy bridge for the camera topic probably keeps the camera rendering even when nothing on the ROS side is subscribed. Check it on your own setup before you rely on it.
Reading ros2 topic bw and ros2 topic hz
# use your own topic name
ros2 topic bw /camera/image_raw
ros2 topic hz /camera/image_raw
ros2 topic bw subscribes with the sensor data QoS (best effort, depth 5) and raw=True. It adds up the serialized length of the last 100 messages and divides by elapsed time on the node clock, showing MB in units of 1,000,000 bytes (bw.py L98–L113, L168–L175). ros2 topic hz uses the same QoS (hz.py L263–L269). Without use_sim_time, the node clock is wall time.
So when bw shows less than the formula, there are at least three explanations:
- RTF is below 1. The formula counts per second of simulated time;
bwcounts per second of wall time. If a 4512×4512 camera kept 19 Hz in sim time while RTF was 0.2, you’d see about 3.8 Hz and about 232 MB/s on the wall clock. That’s arithmetic, not a measurement; the asker didn’t publish theirbwoutput. The maintainer in #332 also pointed out thatros2 topic hzruns on wall time and looks low when RTF is low. - The measuring subscriber dropped frames.
bwandhzreceive best effort. In the test above, a best effort subscriber got 18.705 Hz while the publisher sent 29.999 Hz. A lowbwdoesn’t prove the publisher sent less. - The measuring tool is load too. Receiving big images costs CPU, and in Gazebo the subscription is also what switches rendering on.
The average message size should go the other way: only a few bytes over the formula (52 bytes in the test). If the size bw reports is far from width × height × bytes per pixel, the encoding or resolution isn’t what you think it is.
On a real camera, binning and CameraInfo enter the math
In Gazebo the only way to lower the resolution is the SDF width and height. The SDF camera spec and gz-sensors have no binning setting. gz-sensors fills CameraInfo with the SDF image size and, if you give no intrinsics, computes fx, fy, cx, cy from the render projection (CameraSensor.cc L866–L884). The bridge’s CameraInfo conversion doesn’t set binning or ROI either (sensor_msgs.cpp L219–L274). Change the SDF size and CameraInfo follows.
With a real driver, CameraInfo.width and height are the size at calibration time. Binning shrinks the output to (width / binning_x) × (height / binning_y), and 0 means the same as 1 (CameraInfo.msg L108–L131). 2×2 binning cuts a 1920×1080 rgb8 frame to 1,555,200 bytes. With the ROI left at its default, the received image width should equal CameraInfo.width / max(binning_x, 1), and the same for height. With an ROI set, that simple check doesn’t apply. If the sizes don’t match, don’t use that K on that image.
What to change first
- Compare RTF with no subscriber against RTF with one
gz topic -eon the camera topic. If you run a non-lazy ROS bridge, “no subscriber” means the bridge is stopped too. - If RTF drops with only the Gazebo-side subscriber, look at rendering and readback first. Reduce the SDF resolution,
update_rate, andanti_aliasing(default 4, camera.sdf). - Send synthetic images of your size without Gazebo (the script above, with your resolution) and check whether received MB/s and Hz match the formula. If even that misses the target rate, serialization, transport or the subscriber are at their limit too.
- Then tune depth, reliability, compression and lazy bridging. Compression goes through image_transport. Lowering depth only reduces the queue bound from the QoS section.
Related: ROS 2 rclpy publish() Slow With Large Custom Message Arrays.
Related: ROS 2 depth image pixel to 3D point (XYZ) with camera_info K.
FAQ
How much data does a 4512×4512 Gazebo camera at 19 Hz produce?
An rgb8 image is width × height × 3 bytes, so one frame is 61,074,432 bytes, about 61 MB. At 19 Hz that’s about 1160 MB for every second of simulated time.
Why does Gazebo slow down as soon as I subscribe to the camera topic?
In the Gazebo source, a camera with no subscriber doesn’t render at all. Subscribing turns on rendering, the GPU-to-CPU copy, serialization and publishing together, so the comparison is camera off against camera fully on.
Does lowering QoS depth bring the RTF back?
Depth doesn’t change how often Gazebo renders or how often the bridge publishes. Lowering it limits how many stale frames can pile up and how much memory a queue may hold. There’s no reason to expect it to bring the RTF back.
Why does ros2 topic bw show less than the formula?
The formula counts per second of simulated time, while bw counts per second of wall time, so an RTF below 1 makes it look low. bw also receives best effort, so the measuring subscriber may have dropped frames, and receiving big images is load too. A low bw doesn’t prove the publisher sent less.
Can ROS 2 move 4512×4512 frames at 19 Hz without Gazebo?
Not in this test: with Python on one CPU core, every 4512×4512 run spent 102.071 ms or more per publish() call and published only 4.577–9.784 Hz. ros_gz_bridge is C++ and the asker had an RTX 3070 machine, so this doesn’t show it is impossible over ROS 2.
What this test didn’t cover
- Gazebo didn’t run. How many milliseconds rendering and the GPU copy take, whether a lazy bridge really stops rendering, and how RTF changes with resolution are not measured here. The asker’s 100% → 20% RTF is their report, not a reproduction.
- The synthetic test is Python to Python inside one container, on one CPU, over the default Fast DDS transport. It doesn’t represent a real network, a C++ subscriber or the bridge.
- Only
rgb8was tested. Other encodings and compressed topics change the numbers. - Each condition was recorded for 2.5 s. That’s enough to see the gap between reliable and best effort, but not to describe long-run behaviour.
- No real camera. Over USB or Ethernet, link speed and driver-side compression change the picture.
Sources
All GitHub source links are pinned to commits checked on 2026-10-29.
- Robotics Stack Exchange question 114780 (via the API): the 4512×4512, 19 Hz setup and the RTF drop
- gz-sensors issue #332: maintainer comments on rendering without subscribers, the render thread and wall-time
hz - sensor_msgs/Image.msg and sensor_msgs/CameraInfo.msg (Jazzy)
- image_encodings.hpp:
rgb8is 3 channels of 8 bits - ROS 2 docs: About Quality of Service Settings (Jazzy) and rmw qos_profiles.h
- ros2cli bw.py and hz.py
- SDFormat 1.11 camera.sdf and sensor.sdf
- gz-sensors 8 CameraSensor.cc and gz-sim 8 Sensors.cc
- ros_gz_bridge sensor_msgs.cpp, bridge_handle.cpp and README (jazzy)
- example.py and verification.json: the arithmetic checks behind the tables
- experiment.py and results.json: the synthetic topic test